I’m a little unclear on your second line. When you say you can see CAN flow on the serial output do you mean just with the Uno and CAN shield or do you mean you can see CAN data on serial with the M2? Because, the M2 has a serial output as well. Just trying to get a clearer picture so we can figure out what is going on.
Yes, just with Uno and CAN shield I can see the CAN data on the Serial output of the Arduino like continuous flow of data
But with M2 nothing on the Serial output or on SavvyCAN
I haven’t yet tested on a vehicle but sounds like what I am seeing with both of my M2’s when connected to my lab instead of my vehicle. I will test it tonight to see if I am still getting in vehicle communications. Strange that its working with other stuff and not the M2. But if my M2 works in vehicle with the same software and firmware that is NOT working in the lab then it is a sign something is slightly off with the M2. Haven’t had a chance to take it out and test it yet but I can connect it to a vehicle at work tonight and test it out. We have a 2014 GM truck at work I should be able to test it on.
@collinK is the current SavvyCAN on your site the correct one? I have that and the binaries but seems like when I loaded up the SavvyCAN it only saw 2 ports?
The current savvycan on the site should be the most recent version. If you connect and only see two ports then chances are your M2 doesn’t have the most recent firmware properly flashed on it. SavvyCAN knows if you’ve connected a device with 2 or 3 supported buses and will only show you the buses supported by the firmware on your dongle. So, try updating the M2RET version on the M2.
I JUST updated the firmware via the M2RET_FLASH listed as november 10 and the 64bit binary listed as November 9th and not connected to anything it connected to the M2 but only shows 2 buses. There was a third line but it was empty.
I just now downloaded the 32 bit version and will try that one
Will see how it responds in a few hours at work when it is plugged in.
It said it flashed the image and verified that it was OK.
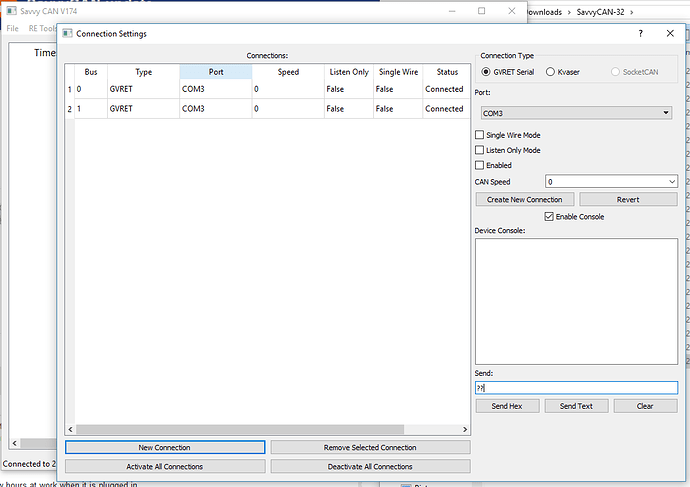
Here is the screen that comes up on SavvyCAN - 32 bit version. I deleted the connection and added a new one with the proper com port.
I am sitting in a class room at GVSU so it is running solely off the USB port which I don’t know if matters but will try later tonight when I get to work.
Also note that I don’t get a response in the console. Not sure if I should be? I hit the ? mark and return 2 times.
Something has gone wrong. Did you see the posting another user made where they had youtube videos of their progress in trying to get it to work? With the console enabled and the board connected you should be seeing a bunch of replies from the M2 that show it’s alive. I thought I was funny and the keep alive reply is 0xDE 0xAD so you’ll see dead, dead, dead in the console if it is alive. You aren’t seeing DEAD so it isn’t responding. Your M2 is not really connecting. I know it says status “Connected” but it’s lying. I’ve disabled some of the actual checks so it doesn’t know if it is connected or not. I should fix that one of these days.
Something isn’t firing up properly with your hardware.
I’ve seen that happen b4, shutting down and restarting SavvyCAN didnt always seem to help, from memory used to pull out the M2 from the car and usb, shut down SavvCAN then reconnecting M2 to car, then firing up SavvyCAN, reconnecting it to the M2.
@CollinK I have found two issues… On your website your 32bit is the wrong version. It is still version 174.
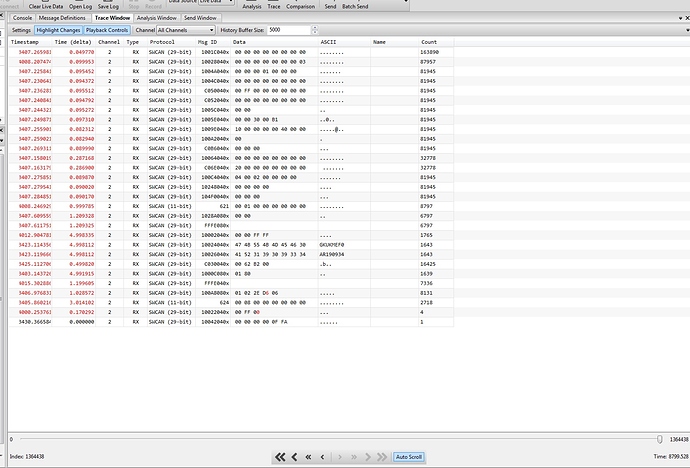
Pictures are from in car…
Here is a screen shot running the windows version I downloaded 5 minutes before typing this message:
Note that it IS working… But only recognizing 2 buses… And latest M2 firmware is loaded.
This is the 64 bit version. ALSO working fine in car… .But no way to adjust the CANBUS speed and did not display the speed until I dropped out and got back into the program a second time.
When more than one bus is active is it logging both buses or just the first one?
Trying to figure out how to just see one of the buses.
Rodney
Collin-
One other suggestion I had for a future version of SavvyCAN. Maybe in the columns where the timestamp, ID, etc shows…
Can you add another column for “interval since last message” per ID?
So say CAN frame $1AD is constantly broadcast by an ECU on the car on a 250mS periodic interval…could you add a column in there that would show how long since the last message? So we could see that there actually is 250mS between each message on $1AD, for example.
EDIT:
Im stupid! I totally missed that the “delta” info was there if you go to “RE tools --> Sniffer”.
But would it be possible to add that “delta” column to the main window, so we dont have to specifically open the Sniffer window?
Sorry, I think I’ve corrected the issue with the 32 bit Windows build now. It got uploaded improperly.
To edit speeds just go up into the list where you see the speed and type in a different number. Hit enter. It’s a bit easier than the previous approach and seemed (at the time) to be more intuitive to me. But, I guess there isn’t any clear visual feedback that you can do that.
When you have 2 or 3 buses on a device it will log them all at the same time. In theory you can turn off one or more of the buses by unchecking the “active” flag but that wasn’t high up on my list of things to fix (though it probably should be) and isn’t terribly well tested. At the firmware itself it does work. If you turn off a bus from the serial console it really will turn off. I’m not sure how well it works through SavvyCAN at the moment.
Add a delta column? Well, I suppose it’d be possible. The problem is that there’s already a whole lot of columns in that view and adding another will just fatten up the main window even wider than it already is. But, I suppose most people use wide screen monitors now so perhaps it’d still be OK.
Yes, you can get this info from the sniffer window. You can also use the frame details window which will let you min/max/avg/deviation for any frame ID too. So, there’s options but none of them are on the main form.
I’ll add this to the list of issues on Github and think about it.
The enabling/disabling busses seems kinda finicky. Sometimes the enabled/disabled check box gets out of sync with the M2 as well…you’ll click enable, and it’ll shut off, click disable, and it will turn on. It seems like sometimes theres just some slight “lost in translation” glitches when using SavvyCAN with the M2. Sometimes things get messed up and out of sync and you have to back way out and start over a little more slowly. Obviously its a beta version, and an incredibly amazing piece of software, but I do just want to confirm that its not something only with my PC or M2?
One more thing…that I have not been able to find and could maybe add to the sniffer window.
An “ASCII” print out of messages? That way, if you’re trying to find a VIN or maybe text messages sent to radio displays, it would be easy to spot…
This is just an example of maybe could make the font smaller, to squeeze more info into the main window without needing a huge monitor?
This is another program I use (PassThroughScope). It doesnt have any of the complex reverse engineering tools like SavvyCAN, it can basically just send messages, show traffic, allow traffic by filters/masks, so its not in the same class as SavvyCAN…but just an example of maybe how things could be trimmed a bit (maybe get rid of the “0x” in front of each message payload data byte?) to fit more info in the main display.
Again, not criticizing at ALL!! But just an outsiders view who has experience with several different bus analysis tools/pieces of software.
Ben
Allowing an ascii view would be interesting. I can pick out ascii text just by looking at the hex values but it’s still nicer to get the actual values and be able to see them. I can figure out where ascii text is but that doesn’t mean I know what all the codes are off the top of my head.
The idea of removing 0x from each hex digit is probably also good. I left those on there because there is a setting to switch the view to decimal and then the 0x is removed and the digits are decimal. There’s a potential issue with supporting two different value encodings and not creating any visual feedback for which is being used. So, almost anywhere in the program where a value is displayed a 0x precedes any value that is in base-16. But, you’re right, that can take up a lot of extra room on the screen. Maybe I should think about changing the color instead or something along those lines.
As for font sizes, yes, I could support changing the font size for the program to allow the user to set a size that is best for them. I like a bit of a larger font size to make it easier to read but a smaller font could be useful to pack more info into a smaller space.
Hi Collin,
A really great tool still learning.
Some potentially helpful features for analysing log files:
Flow View page
- make current frame enterable to jump to known locations
Graph View page:- when synchronizing playback, put a vertical line at current time
- when moving the cursor on page display the x and y values for the cursor location on the X axis frame in a box (similar to many stock montoring pages. Alternatively do this on a button down on page
A couple of quick questions for you Collin.
I got the program to compile and deploy. I did have to change one line in the project file however using VS2017.
Apparently the opengl32.lib line is no longer supported… Here is the change I had to make with the old line commented out.
 win32 {
 #   LIBS += opengl32.lib
    LIBS += libopengl32
 }
One quick question though. Do you have some sort of data creator that you turn on to see stuff for testing?
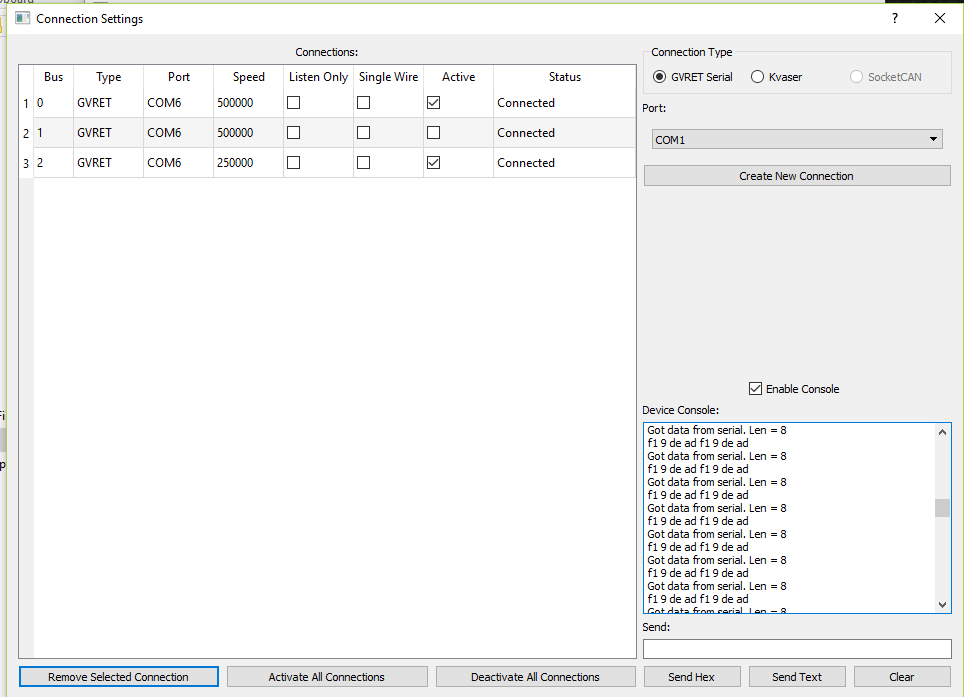
Getting this when I Enable Console. I am using a M2 UTD with the latest M2RET binary installed on it but not connected to anything:
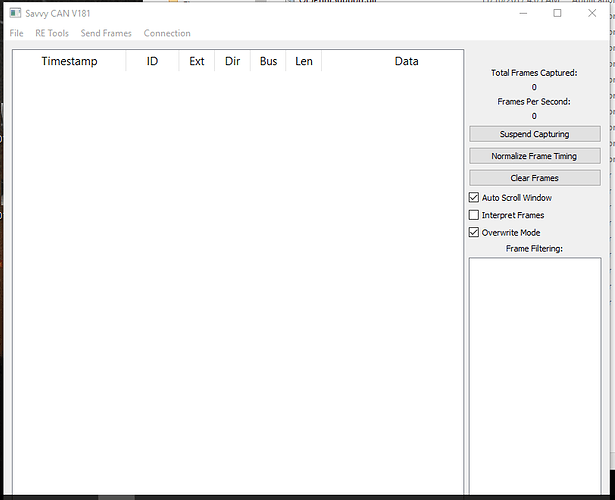
But nothing in the actual capture window. Built from your master branch and shows as V181
Haven’t tried connected to my lab yet but otherwise I expect it is working. I was able to edit the speed by editing the number in the box as well.
You’ve got to love it when they change the names of things between versions. Well, I suppose it’s good that you were able to figure out the new OpenGL library name.
Remember I compile and run in Linux basically exclusively. So, the Windows and OSX builds are done just for other people’s convenience. I actually test a lot of the time with SocketCAN devices. In linux you can create virtual socketcan devices that will send and receive traffic. That’s great for testing. Nothing quite like that is available on windows. But, if you compiled everything and it’s working and you are connected to a vehicle or some other CAN source then you should see traffic. As dmaxben noted, the enable status for GVRET style devices in SavvyCAN is well… not quite what it should be. Sometimes it says enabled but isn’t really. Sometimes power cycling the M2 could help. Sometimes restarting SavvyCAN. You can check that a bus is enabled and set to the proper speed by connecting to the M2 via a serial console and bringing up the config console with ? (followed by Cr, or Lf, or CrLf). You should see that the buses are enabled and set to the proper speed. If that’s true then connecting in SavvyCAN should show any traffic that exists. Not all cars actually show CAN traffic on the OBDII port without coaxing. Some of them do require you to send something to them first.
One thing is for sure, you do have the M2 connected. F1 09 DE AD is the reply from the M2 when it is alive and connected.
Ok cool. So then it is working correctly. Just wasn’t sure what I was seeing.
The weird thing is that when running in debug mode the program dies when I tell it to disable a channel. Tells me something about it is trying to communicate with a thread that isn’t there. I don’t see this when running the deployed version.
What variant of Linux are you running? I probably should set that up and get it running for this. Probably use my ESP32 VM to work with it. I have been using Ubuntu for all of my Linux stuff. Been using 14.04 or 16.04 for most things but also try to have the latest ubuntu up and running for stuff too.
I use LinuxMint 18.3 which is based upon Ubuntu. I believe Mint is the most common distro these days. You can’t hardly go wrong with Ubuntu or one of its derivatives. Pretty much everything supports it.
I’ll try out the debugging console with the debugger active and find out why it crashes like that. (if it does in linux). Otherwise hopefully some day I’ll remember to boot into Windows and try it there.
Didn’t happen in the deployed version. Just when in VS. Seemed like it did it when the connections screen was open. If it is a fork it is possible the method your using to talk between the connection screen and the normal screen is buggy. It only seemed to crash when I did it when you were changing some functions from the connections screen and it was communicating between the two.
As to the library change. When I looked up the opengl32.lib missing error the first one I saw said that this library was depreciated so use the other one instead. So it looks like the name change is more than a simple change of names.
When I compiled on Windows as I think I mentioned it showed almost 60 issues but nothing that looked like it was related to thread communications. Just simple stuff, mostly comparing unsigned ints to signed ints and variables created but never used.


